

Hasta La Vista, Baby!
- Jan 6, 2019
- 10 min read
This blog was originally published July 16, 2018. It was updated 1/6/2019.
I can hear Kenny Loggins singing “This is It” in the background. The long-expected bear market is here. Yep, that creaking noise you hear behind you is the door closing on the nine and a half years U.S. bull market. On the whole, it was not something to write home about. Since the 2007 S&P 500 high of 1576.08 October 11, 2007 it only gained 77.9% to Friday, July 13’s high. The S&P 500’s 2007 gain was only a smidgeon above the 1552.87 from March 2000. Since this is a total return index and was inflated by 13% in dividends by the end of 2007, this was really a continuation of the 2000 bear market. That being the case, this bull market only yielded 80.6% or a compounded annual yield of 3.3%. When one considers the average dividend yield for that span was 1.9%, it leaves only a 1.4% capital gain per annum - a far cry from the average 6% from 1929 to 2000, which when dividends are included is three times this bull market's compounded return.
Was Friday’s close the market top? Maybe. As I previously reported[1], all major bear markets since the S&P 500’s inception always have a prelude – a substantial drop from an initial peak followed by a recovery to a second peak whereupon it drops in earnest. Spans between the first and second peak vary but the longest was 165 days, between March 5 and August 17, 1937, 110 trading days. That was eclipsed this Friday, July 13, when the market went 168 days and 110 trading days without topping. The 2000 market at 161 days (March 24 through September 1) still holds the record for trading days at 112. This market started out making history back in 2017, before the first peak, when it broke the record for most consecutive days without a 3% drop and is now closing in the same fashion.
I have long held that March 13’s S&P 500 charge up to 2801.90 was (1) too early to be the second peak and, (2) would need to be surpassed before the second peak climaxed. With last Friday’s intraday high of 2804.53 we have passed that marker. It’s anyone’s guess what happens next. Historically, the range for the second peak in major bear markets has been from -7.4 below the first peak to +2.9%. The low point came in 1929 and since then the median has been -0.6%. With Friday’s high 2.4% below the January 26 high, that leaves us with an upside potential of 5.3%. However, there is no reason this market should not continue its record-breaking trend and go beyond the historical range. Then again, the market is looking awfully tired. The constant struggle to push back after Trump’s intermittent tariff announcements has taken its toll. While I would not be surprised if Friday’s high was it, I think we may struggle through another percentage point higher before we run out of gas and start the long road down.
I have already discussed demographic reasons why our economy would go through a major downturn.[2] Despite May’s surge in retail sales, these demographic causes have been manifested in struggling retail sales for the first three quarters of 2017 and the first four months of 2018. This was particularly so in businesses depending on discretionary spending such as auto dealers, building materials dealers and department stores.
The May surge is more likely due to a wealth effect bolstered by a tax-reform induced good profits season that has propelled the market near all-time heights than from fundamental improvements in consumer spending. The surge is transitory. What is fundamental, however, is the continuing erosion of peak spender numbers. Its effect will be felt throughout our economy, eventually exerting downward pressure on the stock market. I believe that endpoint is upon us.
and the repercussions will be felt everywhere, regardless of domicile. As shown in the charts below, major international stock markets have been moving in concert to U.S. markets for the past 30 years. Thank globalization for that. Therefore, it pays to monitor the U.S. market and what is coming is not good news.
Some across the pond may dismiss U.S. demographic woes as unique to that us but the repercussions will be felt everywhere, regardless of domicile. As shown in the charts below, major international stock markets have been moving in concert to U.S. markets well before 2000. Thank globalization for that. Therefore, it pays to monitor the U.S. market and what is coming is not good news. By the way, it does not always work the other way around. U.S. markets can move independent of other nation’s troubles as evidenced in recent years when U.S. markets were little fazed by European fiscal problems and today continue to flirt with record highs as China wallows in a bear market.

Source: Finance.Yahoo.com

Source: MarketWatch
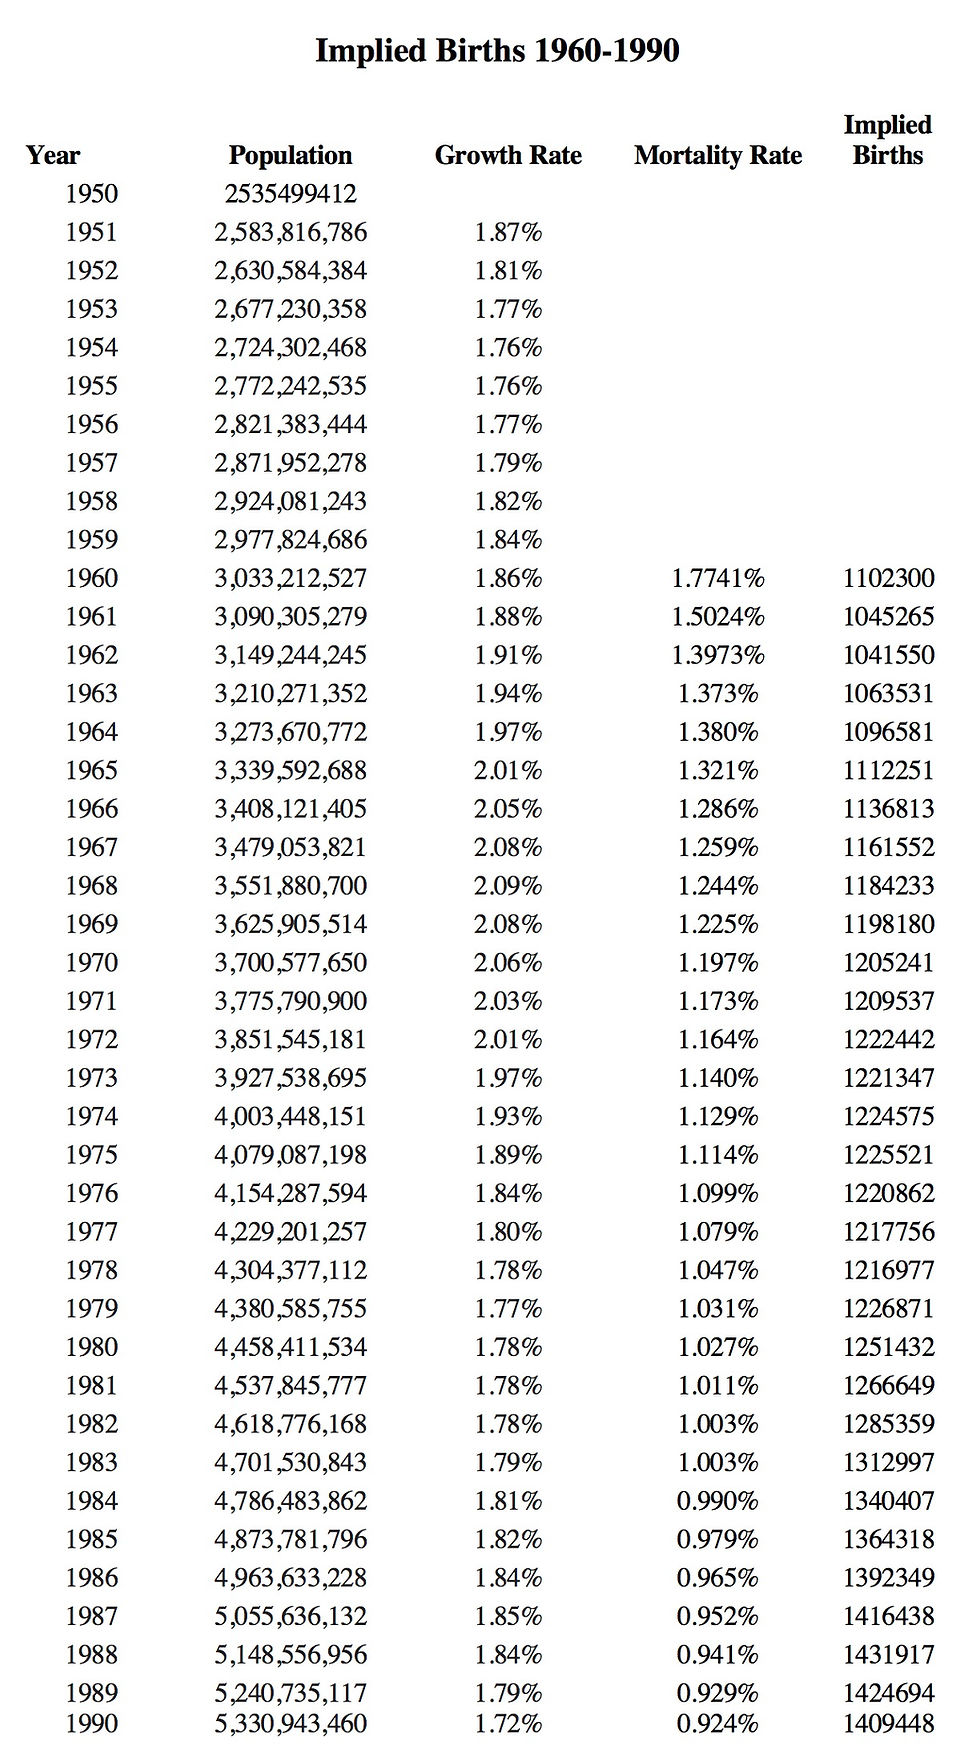
Moreover, the very same forces that drove births up during the U.S.’s Baby Boom were also at work globally. As data from Worldometers (www.Worldometers.info), summarized in the table below, show, population growth increased globally from 1945 through 1968, a span similar to our Baby Boom, where it topped out at 2.09%. Adding mortality rates from the World Bank to population growth rates we can come up with implied births. While World Bank data only goes back to 1960, it does encompass some of the key years and these clearly show that births stalled between 1969 and 1979. That means that, starting this year, we can expect little global growth in peak spender populations, those 46-50 years old, until 2028. That already peaked for the U.S. and will continue to decline until it recovers in 2013. That means we will see declining discretionary spending in the U.S. and no growth globally in discretionary spending categories for an extended period of time. With no earnings growth visibility in the foreseeable future, stocks will suffer.
Having arrived at the traditional topping range, what can we reasonably expect moving forward? One likely thing is that it will be difficult to tell we are on course to a bear market at first. Those expecting much fanfare, volatility and a huge bull/bear rumble, will probably be sorely disappointed. If this market follows the historical script, this bull will go out with a whimper.
When I was doing my research on an article[3] about what we could reasonably expect for this downturn, I was surprised at my findings. They seemed to go against those I unearthed for my book, And Then the Tempest – The Imminent Financial Meltdown is Real and What to do About It. Back then I found the 2000 and 2007 market tops were accompanied by extreme volatility. Some of the largest gain and loss days took place in the first month of each market top. What I have discovered since is that major bear markets usually have at least one drop and recovery before finally succumbing. Both the 2000 and 2007 tops I reviewed for the book came at the first, not the second, peak before the market dropped 13.7% and 11.9&, respectively.
At this time, still bolstered by the recent high, bulls were still feisty, full of verve and fought off bear advances with a vengeance. Eight of the ten best gains for the entire 2000-2004 period occurred during the downturn. Among them were gains of 3.33%, 3.31% and 2.87% in the first month. On the other side of the ledger, the first month after the March 24, 2000 S&P 500 climax had top losses of -5.83%, -2.23%, and -1.82%. The gain tally for the 2007 downturn was not as generous with top three gains of only 1.38%, 1.20%, and 0.88% in the first month after the October 11, 2007 S&P 500 top. Bears did much better with losses of -2.94%, -2.64%, and -2.56%.
By contrast, the first two weeks after the second peak top for the 2000 and 2007 bear markets showed little volatile behavior and did not approach correction territory a month later. In fact, investor response seemed anemic. It seems, by the time the second and decisive peak came around, bulls were demoralized. After months of pushing back, the market’s failure to move beyond the old highs weighed on their spirit and they slowly caved in.
This time around will be no different. The market climbs a wall of worry. Early on it was interest rates and the prospect the Fed might become more aggressive in raising them. Since early February, however, the market’s attention has turned to trade, more to the point tariffs. It seems every time “the great dealmaker” turned the screws on his tariff rhetoric the market dropped and was forced to slowly climb back. It has been an exhausting process. Now, with anecdotal evidence from Harley Davidson and others that the rhetoric has morphed into real business consequences, the market has once again clawed its way back. This time, however, it looks like the market is running out of gas. The latest moves up seem to lack conviction as evidenced by last Thursday’s, which came at 84% of the average volume for the past 20 days, and Friday’s meager move, which came at 78% of the average volume.
What follows is a summary of market behavior for every major bear market since 1929 that, like ours, was preceded by a correction. There are six of them starting in 1929, 1937, 1946, 1969, 2000, and 2007. S&P 500 data is used for the 1968, 2000, and 2007 bear markets. Dow Jones closing data[4] was used for all bear markets before that.
The chart below gives the relative performance for the first month of each decline. The accompanying table summarizes the 30 days after the top for each. This includes the worst five declines during that time with the day from peak given in parenthesis.


As can be seen from the chart, all the bear markets declined gradually for the first week. In fact, it was rare to find a substantial drop during that first week. Except for 1969, none of the largest percentage drops took place during the first week and those were only -0.92% and -0.89%. Markets did begin to diverge during the second week with the 1929, 1937, and 2000 markets dropping 15%, 6%, and 5%, respectively, after 10 trading days. Note that, once the top was reached, there was no turning back. Instead, most markets had a steady decline. The only exception was the exceedingly volatile 1929 market.
This is an important point for our market due to the March 13, S&P 500, 2801.90 intraday high. This placed it within 2.5% of the January 26, 2018 high, just within the window for the second peak topping range. That would have placed that potential second peak historically early for a major bear market with a correction preamble. The fact79trading days later we are still waffling back and forth and in a recent uptrend is in stark contrast to previous major bear market profiles and argues against that being the second peak.
Daily volatility is shown in the table above as the Daily Change - the absolute value of the difference between that day’s close and the previous day’s. Note that, except for the 1929 market, volatility was low the first 10 trading days after the second peak’s top, as measured by the Daily Change average, median, or standard deviation. It was rare to see large percentage drops in the first week of trading, as noted above. Volatility increased substantially after the first 10 days, as shown by 30-day data, particularly the Daily Change Standard Deviation. Not surprisingly, 1969, with two top losses in the first week, was the only exception.
Note that, except for the 1929 market, which by that time was recovering, none of the markets had reached bear territory 30 trading days after the market peak. Technically, the 1937 market had dipped into bear territory days before it but was only sitting 19.1% below the peak by day 30. All the other markets were only approaching correction level territory.
Given that summary, it is likely that we will also experience a gradual decline with little damage the first week. In fact, with large loss days paling in comparison to those we saw in early January, it may well lull investors into a sense of complacency leaving them with no sense of urgency. Having gone through a long correction already, there will likely be little concern a month and a half later if the 30thtrading day arrives with losses still in the single digits. That would be a mistake as the bear relentlessly creeps up on us. After profiting from the recovery since the drop in April, I liquidated all my stock holdings late this past week and recommend everyone do the same.
Those curious above where to put their money into, I cover recommendations in Part 2 of my book, featured on the home page. Whether you are a conservative or aggressive investor, there is something for you. Recommended investments, as well as those to avoid for now, are covered along with instructions for Dive charts, useful in approximating market and stock bottoms. Those interested can purchase the book through Amazon (https://www.amazon.com/Then-Tempest-Imminent-Financial-Meltdown/dp/1478796731/ref=sr_1_1?ie=UTF8&qid=1531796684&sr=8-1&keywords=and+then+the+tempest) available both in paperback and Kindle online versions, and Barnes and Noble (https://www.barnesandnoble.com/w/and-then-the-tempest-karl-de-jesus/1128799915?ean=9781478796732) among others.
1/6/2019 Update
This historic market continued its mold breaking trend by taking longer than any other major bear market to finally reach its second peak. This took place September 21, 2018 with an S&P 500 intraday high of 2940.91. That was 2.4% higher than the first peak top, within the traditional range previously reported, and came 159 trading days or seven months and three weeks after the first peak top.
Nevertheless, once it topped, it behaved much like all the other major bear markets. After a whisper quiet first 10 trading days, the slumbering giant finally woke up to big volatility as it dropped 3.19% and 2.06% in quick succession on trading days 13 and 14, respectively. As the accompanying "Act 2" blogs noted, it went on to fall 11.5% from the second peak top by day 26 - in line with the average 30.9 trading day average to the initial market bottom for other major bear markets. It continued on script by having two short-term recoveries. The first took place by trading 33 with am 8.1% gain from the bottom. The other is taking place at the time of writing with, thus far, an 8.2% gain from the second bottom on trading day 64.
[1]The Coast Is Not Clear – Signs of an Impending Major Stock Market Crash,Karl De Jesus, Ezine Articles, February 20, 2018 (http://ezinearticles.com/?The-Coast-Is-Not-Clear---Signs-of-an-Impending-Major-Stock-Market-Crash&id=9889873), updated with charts in Not Out of the Woods.
[2] It’s Not Over, Karl De Jesus, Ezine Articles, April 9, 2018 (http://ezinearticles.com/?Its-Not-Over&id=9880006).
[3] The Market Approaches a Top - What Can Be Expected?, Ezine Articles, April 19, 2018 (http://ezinearticles.com/?The-Market-Approaches-a-Top---What-Can-Be-Expected?&id=9925663).
[4] Dow Jones Industrial data was accessed from Wharton Research Data Services. "Dow Jones " wrds.wharton.upenn.edu, 05/31/2018.


Comments